import covid
import matplotlib.pyplot as plt
#CREATING INSTANCE
cov = covid.Covid()
#GENERATING DATA
name = input(‘enter the country name ‘)
virusdata = cov.get_status_by_country_name(name)
#ACTIVE
active = virusdata[‘active’]
#RECOVERED
recover = virusdata[‘recovered’]
#DEATHS
deaths = virusdata[‘deaths’]
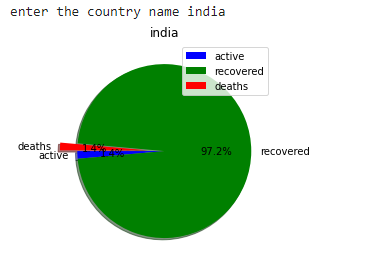
#PLOTTING THE PIE PLOT
plt.pie([active,recover,deaths],labels=[‘active’,‘recovered’,‘deaths’],
colors = [‘b’,‘g’,‘r’],explode=(0,0,0.2),
startangle = 180,autopct = ‘%1.1f%%’,shadow=True)
#DISPLAYING THE PLOT
plt.title(name)
plt.legend()
plt.show()